The Logic Behind the Math: Dow Theory & Equilibrium
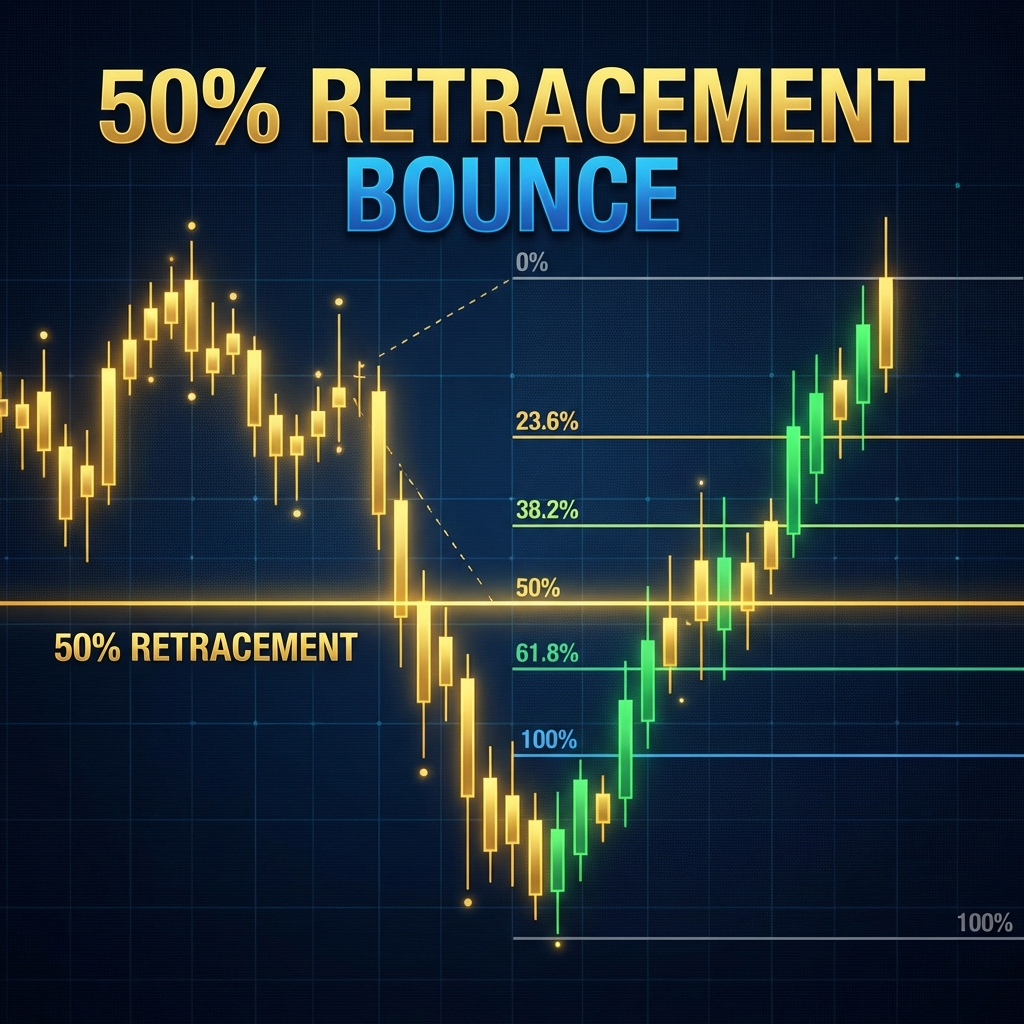
The logic of the 50% rule is rooted in Dow Theory. For a trend to be healthy, it must "breathe." A 100-point move followed by a 50-point pullback suggests that 50% of the sellers have been absorbed by new buyers who missed the initial move. This creates a Higher Low. Mathematically, the calculation is a simple arithmetic mean: $(High + Low) / 2$. The edge comes from identifying which high and low the rest of the market is looking at.
Step-by-Step Solved Trade: Buying the Dip in Nvidia (NVDA)
Scenario: NVDA rallies from $100 (Swing Low) to $150 (Swing High). It then begins to pull back.
- Step 1: Identify the Range. $High = 150, Low = 100$.
- Step 2: Calculate the Golden Level.
(150 + 100) / 2 = 125. - Step 3: Define the Zones.Premium: $> 125$. Discount: $< 125$.
- Step 4: The Entry Strategy. Wait for price to touch $125. Look for a "Rejection Candle" (Hammer or Engulfing) on a lower timeframe.
- Step 5: Risk Management. Set a Stop Loss at $118$ (just below the 61.8% Fib) and a Take Profit at $150$ (the previous high).
- Step 6: Outcome. If price hits $125$ and rallies to $150$, your profit is $25$ points for a risk of $7$ points (RR of 3.5:1).
Alternative Methods: Gann Fans and Median Lines
While the 50% horizontal level is powerful, some traders use Andrews' Pitchfork or Gann Fans to find the "Sloping 50% Level." These tools apply the same equilibrium logic but account for the Time factor. The median line of a pitchfork is essentially a dynamic Golden Level that adjusts as the trend progresses.
Trader Trap Alert: The "Falling Knife" Fallacy
One of the biggest pitfalls is assuming the 50% level must hold.
Professional Warning: In a crashing market (Black Swan event), equilibrium doesn't exist. Price will slice through the 50% level like a hot knife through butter. Do not set "blind" limit orders at the Golden Level. Always wait for Price Action Confirmation (lower timeframe structure shift) to prove that buyers have actually stepped in.
Practice Setup: The 5-Minute Equilibrium Scalp
Open a chart of a volatile asset (like Bitcoin or Tesla). Identify the move made in the first hour of trading. Calculate the 50% mark. Watch how the price reacts when it returns to that level during the lunch hour. Does it bounce, or does it consolidate? Recording these reactions is the first step to building a Quantitative Edge.