The Logic Behind the Math: The Mean of Extremes
The core logic of a Pivot Point is calculating the Average Price of the previous session. By averaging the High, Low, and Close, we find the "Balance Point." The Support and Resistance levels are then derived from the Range (High minus Low) of that session. If the previous day had a wide range, the pivots for the next day will be further apart, indicating expected high volatility.
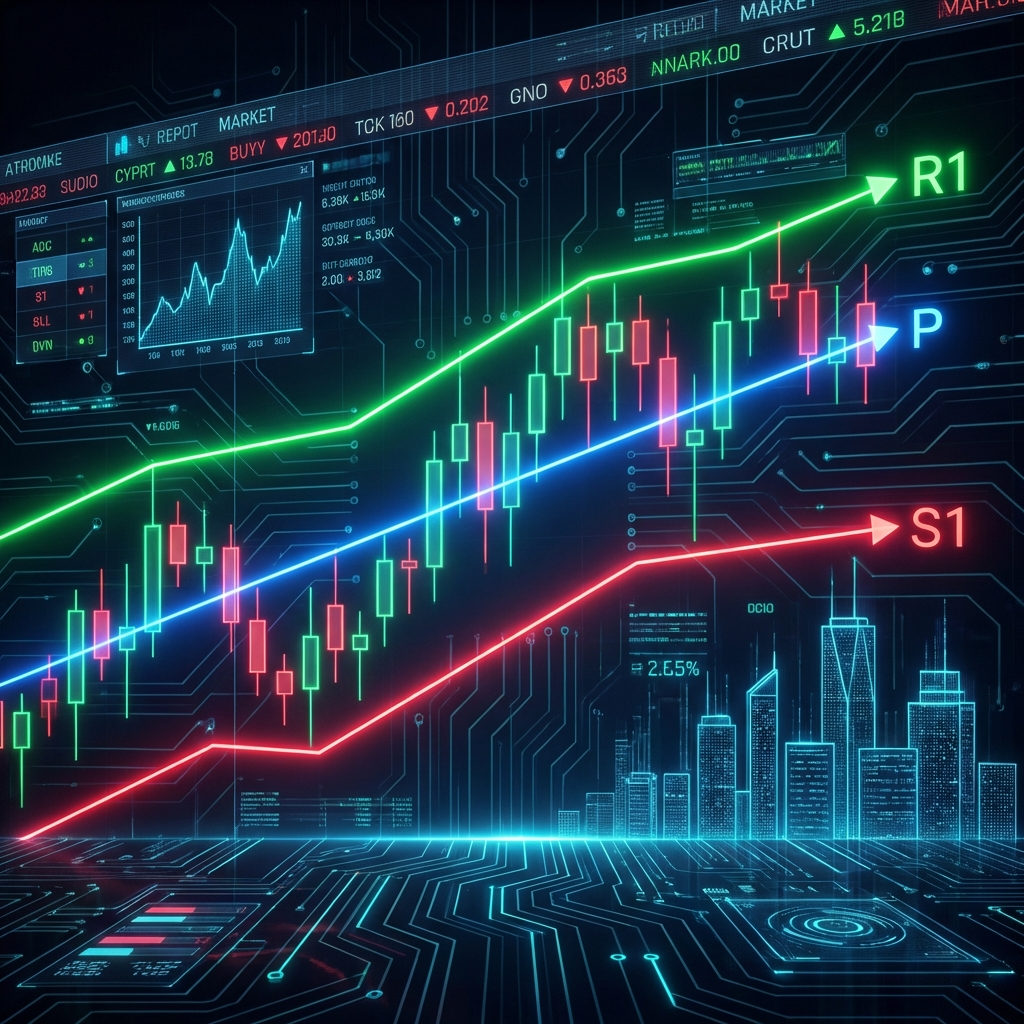
Step-by-Step Solved Trade: The "R1 Reversal"
Scenario: Yesterday, Gold (XAU/USD) had a High of $2050, a Low of $2010, and a Close of $2030.
- Step 1: Calculate the Pivot (P).
(2050 + 2010 + 2030) / 3 = 2030. - Step 2: Calculate Resistance 1 (R1).Formula:
(2 * P) - Low.(2 * 2030) - 2010 = 2050. - Step 3: Calculate Support 1 (S1).Formula:
(2 * P) - High.(2 * 2030) - 2050 = 2010. - Step 4: Execute the Setup. Today, Gold opens at $2035 (above the Pivot). You have a bullish bias. However, as it approaches R1 ($2050), price starts to stall.
- Step 5: The Trade. You sell at $2048, targeting a return to the Pivot ($2030). Your stop is just above R1 at $2055.
Alternative Methods: Woodie's and Camarilla
- Woodie's Pivot: Gives more weight to the Opening Price of the current period. It’s preferred by fast-paced scalpers.
- Camarilla: Uses 4 levels of support and resistance. It is famous for the "H3/L3" mean-reversion levels and the "H4/L4" breakout levels. If price hits H4, it is considered a "Volcanic Breakout."
Trader Trap Alert: The "Lagging Data" Mistake
A common pitfall is using the wrong timeframe data for your trading style.
Quant Warning: If you are a day trader, you must use Daily High/Low/Close. If you use Weekly data for a 5-minute scalp, the levels will be too far apart to be useful. Conversely, using Daily pivots for a swing trade that lasts weeks is like using a magnifying glass to look at a mountain.
Practice Setup: The "Pivot Bounce"
Identify a stock that is trending strongly. On the next trading day, observe how the price behaves when it touches the main Pivot Point (P) for the first time. Does it act as a "Springboard" to continue the trend? This is the most basic institutional setup.